
The following is a conceptual framework for what I hope becomes a model to help us baseball lovers better evaluate certain aspects of baseball organizations such as general managers effectiveness and farm system efficiency.
This will be done in multiple posts to retain the attention of readers. My approach is driven by the simple model of the firm and the many economic principles that go along with that method. The economic fundamentals used in my research have been slightly adapted to fit the constraints of baseball. For example, instead of dollars, the WAR stat might be used to calculate a value. Also, certain economic equations break down when using them in a pure baseball sense, so alterations and in some cases new equations were needed to comply with these baseball controls. I will do my best to explain these adaptations as I go along. I must admit this was challenging and I still feel there are several areas in which my thought process might be flawed. Hopefully, with enough time and tentation I will be able to come to some meaningful conclusions.
The first concept I will attempt to apply to evaluating general manager performance is the difference between accounting profit and economic profit. This idea had to be altered to fit the model of Major League Baseball organizations. So instead of accounting and economic profit, we will look at team WAR (tWAR) and economic WAR (eWAR). I chose to use wins above replacement in place of dollars since it seems to be an all-encompassing statistic that can be applied to individual players as well as a team. Team WAR is also nicely correlated with team winning percentage.

Before I get into how I intend to use eWAR to evaluate teams and their baseball operations, let me briefly explain the difference between economic profit and financial profit. The term “accounting profit” refers to the actual revenue calculation of a firm. “Economic profit” is more of a theoretical figure as it takes lost opportunity cost into consideration along with the accounting portion. In my baseball version of the concept, total WAR takes the place of accounting profit and eWAR takes the place of economic profit. So instead of just looking at team WAR to evaluate a team’s performance, we can look at the economic WAR to account for lost opportunity costs of players traded, released, or in some way removed from the team.
The formula for eWAR:
eWAR = Total Team WAR – WAR of Players Exported from the Team
Team WAR is pretty self-explanatory. WAR of players exported from the team was derived by looking at how well each player performed that year for their new team. For example, Albert Pujols joined the Angels in 2012 and amounted 4.8 wins above replacement. Based on how I am calculating economic WAR, the St. Louis Cardinals had a lost opportunity cost of 4.8 WAR in 2012 for not resigning him. Essentially, eWAR is trying to explain if GMs and front offices are making appropriate decisions about player personnel. I realize this does not work 100% of the time, especially if management has to make decisions based on payroll constraints. For example, not signing Pujols to a long-term contract put St. Louis in a better financial situation. eWAR should be left to evaluating teams based solely on the on-field performance in that year. Also, this is not a predictive statistic, but it can be used as a performance measurement indicator.
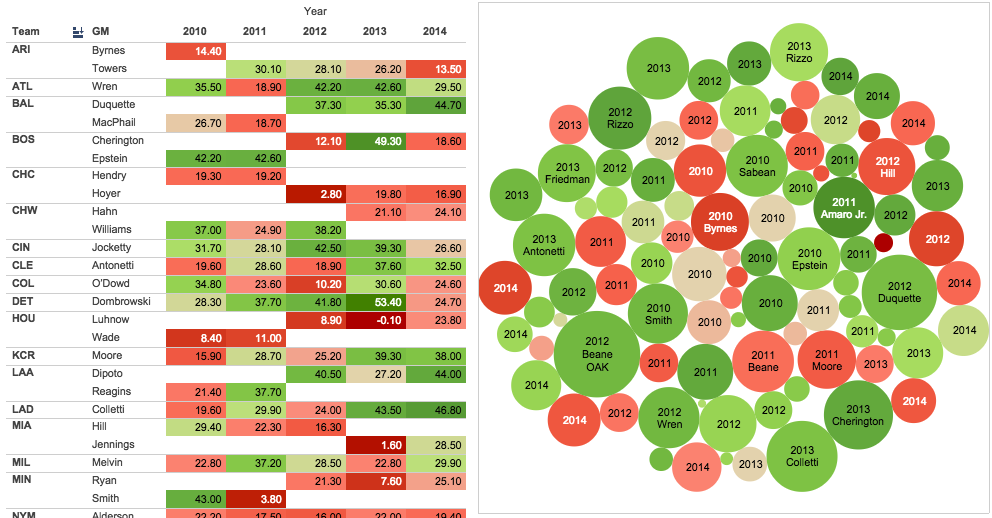
Here is a highlight table I created, going back five years, that shows the seasonal economic WAR for each team. Click on the link for the full interactive version of the chart. You can hover and compare the teams eWAR, with their total WAR and winning percentage for each year.
Link to interactive highlight table

After analyzing the table there were a few observations I found interesting. In 2014, Detroit was the only playoff team that produced a below average eWAR. Their team WAR was 41.70, but due to the high production of some notable departures, their eWAR was 24.70, representing a lost opportunity cost of 17. The Dodgers put up an eWAR higher than their team WAR for 2014. This could be considered a good thing. LA removed players that as a whole performed below replacement level in 2014 on their new team. It can be seen that Oakland, St. Louis, and Tampa Bay are the only teams to have an above average eWAR in each of the last five years. While eWAR allows us to see if front offices are making good player decisions in a broad sense, we can use another widey known economic measure to drill down even further.
The next concept I will attempt to apply to evaluating general manager performance is gross domestic product. The formula for the GDP expenditure approach is the sum of consumption, investment, government spending, and net exports. Just like before, this equation had to be altered to fit the model of Major League Baseball organizations and once again we will use WAR in place of dollars. I will call this new measure “gross domestic WAR” (GDW), so that there is no confusion with the contemporary GDP calculation. GDW will be used to evaluate the transactions teams make each year. Unlike eWAR we will leave out the WAR for returning core players in order to isolate player transactions. This will allow us to compare the performance of players the team acquired versus the players they let go or traded.
GDW can be determined by taking the sum of wins above replacement for the team’s call-ups and the wins above replacement of net imports (GDW = WARcallups + (WARimports – WARexports). The call-ups consist of any player(s) moved up from their affiliated farm system to the big league club in any given year. For example, George Springer was a rookie in 2014 and contributed 2 WAR to the Astros “WAR call-ups” total that year. We used WAR of exported players in our calculation of eWAR, but just to remind you, WAR of players exported from the team is derived by looking at how well each player performed that year for their new team. WAR of imported players comes from those players who are new to the team, but were not call-ups from the team’s farm system. These are players who were acquired via trade or free agency.
I have created a bubble chart to help visualize the concept and display the information. If you clicked on the link to the interactive table above you probably already saw this chart. I suggest you go back to the dashboard and play around with the bubbles this time.
(Note: There are 53 instances of negative GDW seasons not displayed in this chart)
Link to bubble chart
Of the last five years, Billy Beane’s 2012 A’s had the highest gross domestic WAR of any team. In that year, the WAR of A’s call-ups and acquisitions outnumbered the WAR of their player departures by 23. Take a peak at the 2011 Phillies led by Ruben Amaro Jr. It would seem the core group carried the team to their winning percentage of 63%. The 11.6 GDW, although not terrible, would most likely not have come close to providing the type of value the returning players brought that year. This reliance on the core group could be a reason why the team started a sharp decline over the next three years. Certainly a team needs a core group of players to build around, but after analyzing the data I have come to the conclusion that sometimes teams do a poor job of preparing for the future such as adding good new players and getting rid of bad players. Obviously, this is not a revolutionary idea. Of course teams want to get rid of failing players and replace them with good ones. What I am attempting to do is to slightly quantify this notion.
I am including a link to the raw data on a Google spreadsheet. In the next post I will attempt to evaluate team farm systems based on several business performance measures.
Next post: 2015 Wild Four Tournament (First Round, Part 2)
Previous post: Boston Red Sox Team in a Box

Leave a Reply