
Last week I tried to assemble a conceptual framework for evaluating general managers and front offices by applying a couple of economic principles to player acquisitions and departures. This week we will add a few more performance measures by looking at team draft and farm system efficiency. The overall goal is to create a dashboard of indicators that can help us understand how well a team’s front office is performing their duties in addition to the typical winning percentage and eye test measures.
Similar to last week, I will begin by explaining the economic/business performance measures that I applied to my evaluations. To create a key performance indicator (KPI) for team’s draft classes and farms systems I had to view baseball organizations in a non-traditional form. The simple model of the firm will once again be the baseline for my approach. Using this method, players are viewed as materials in a manufacturing process and each team’s farm system is the plant. Like simple manufacturing companies, players can be broken down into three types of materials, Raw Materials or Inputs, Work-in-Process, and Finished Goods or Outputs. These assumptions lead to the KPI’s that will help round out our front office assessments. If you are more of a visual person the graphic below will help explain.

The first chart will allow us to see the average draft efficiency of each team for the last seven years. This was calculated by dividing the total number of outputs for each team since 2007 by the total number of players drafted by each team since 2007. The term “outputs” refers to players who have completed their journey through the baseball manufacturing process. A player is considered an output (finished good) once he has played in at least one major league game with no discrimination with which team the player makes his debut. We will look at player outputs for the team they were drafted by when we get to Farm Efficiency. Draft Efficiency only attempts to get at how well each team can judge talent by how many of their draft picks end up making it to the big leagues. This is not perfect since there are players that only play a few games for the big league club and then go back to the minors. I am assuming that if the player has played at all for a major league team then the team considers that player at least somewhat capable of competing at the highest level. Take a look at the bar chart below organized from highest to lowest efficiency. This chart shows the average percentage of players drafted by each team that have made it to the big leagues, over the last seven years.
(Click on any chart in this post to be redirected to an interactive version)

Howard Megdal, baseball writer, and the Effecively Wild guest for the Cardinals preview raved at how well St. Louis has drafted players over the last few years. He credited the Cardinals front office, going back to the days of Jeff Lunhow, for putting a heavy emphasis on keeping a full pipeline of outstanding prospects. Needless to say after hearing this on the EW podcast it was not surprising to see them near the top of this chart. The Rangers where near the top which I also might have guessed considering their emphasis on acquiring and developing young talent. So how do we interpret teams like the Padres and the Diamondbacks being near the top?
Take a look at this bullet graph showing team outputs compared to total outputs of each team’s draft class going back to 2007. The blue bars are team outputs and the bold lines to the right are the total outputs. Just a quick reminder of the difference between team and total outputs. Team outputs are those draft picks that made there debut with the team in which they were drafted. Total outputs are all the draft picks for a team that made the big leagues at some point regardless of which team they made their debut.

By analyzing this chart one can see that just because a team can draft great talent does not mean that talent will contribute to the team in the future. Teams with a large gap between their team outputs and their total outputs are ones that have exported major league caliber players before they were able to contribute to their team. Some clubs do a really good job of drafting players, but either trade them away or fail to sign them. This causes those players to move and add value to another team. According to the chart, this does not seem to be a problem for clubs like the Red Sox and Yankees. This is most likely because their budgets allow them to sign high performance free agents to counter the loss of their top level farm prospects. In the case of the Padres and Diamondbacks, who have struggled over the past few years, one need look no further then the difference between their team and total outputs. They are putting together solid drafts, but they are letting those prospects leave their system a little to early. There are some smaller payroll teams that do hang on to their talent such as the Rockies, but their team outputs are not high enough to give them a significant advantage. Next, I will use team outputs along with a couple of other measures to get a better understanding of how effective each team‘s farm system is at developing players.
Farm Efficiency and Lead Time are the last two metrics I will use to evaluate baseball organizations. These calculations will help determine the overall productivity of each team’s minor league system. The visual below shows the Farm Efficiency of each team during the years from 2007 to 2014. It is determined by dividing the team output by the total number of players signed from each draft class. For the time being, I have chosen to only include players entering the system through the June amateur draft. In the future I hope to incorporate other means of initial player acquisitions as well.

This time St. Louis actually takes the top spot. It would seem Mr. Megdal’s observations were correct in that the Cardinals really have done a great job drafting and developing amazing talent. It is no surprise that Oakland is near the bottom considering they like to draft then trade talent. Their farm system seems to be more of an inventory warehouse than an actual manufacturing plant. However, one could speculate that Oakland, and maybe other teams, still do a decent job at developing players since they are using those players to acquire proven big leaguers. Then again, maybe teams are trading for the potential upside of Oakland’s minor league prospects which would mean current development is at least partially irrelevant.
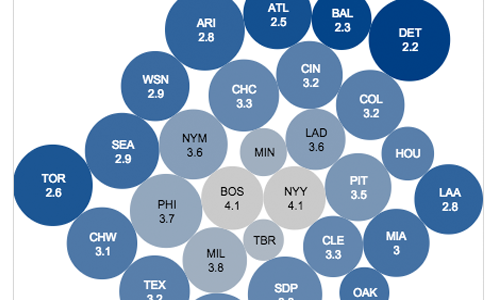
Lead Time is the last KPI I will attempt to apply to baseball farm systems. In a manufacturing plant the amount of time it takes an input to turn into an output is called the lead time. For example, one could calculate the lead time it takes for an automobile to go thru its various stages of assembly in route to becoming a finished product. I used Lead Time to determine the time it takes a signed draft pick to turn into a major league baseball player for the club in which he was drafted. Like Draft Efficiency, a player is considered to be an output after he has played in at least one major league game. Below is a bubble chart that helps to visualize the average lead time for each team since 2007. The darker the shade of blue the shorter the lead time and the larger the bubble the greater number of team outputs.

If you are having trouble understanding what this means – I know I did at first – think of it this way. Look at Detroit. From 2007 to 2014, It took on average 2.2 years for Detroit’s 24 draft picks to reach the pros. I am not saying it is good or bad to have a small lead time. A team might have a small lead time, but be putting low quality talent on the field. The goal should be to develop and advance high quality players in the shortest amount of time possible. To understand which teams do this the best we can look at teams with a short lead time whose yearly call-ups are performing at a high level. Let’s use Detroit as our example again.
According to the bubble chart above Detroit has the shortest lead time at 2.2 years. The graph below was taken from the dataset I used to determine eWAR and GDW which I laid out in Part 1. It shows the total WAR for all call-ups for each team going back five years.

Detroit sets at 13.3 WAR for all call-ups during that time with the best being the Texas Rangers at 18.4. It would seem Detroit is capable of producing relatively high performing prospects at a fast pace. Much more analysis can be done, but I will stop here as to not drag on too long.
I plan on combining these visuals into a dashboard and using it to rank each club’s overall performance from year to year. By no means is this fully tested and in the future I will most likely add and subtract various concepts. For instance, it might be interesting to use projected WAR to calculate a rough estimate of a team’s economic wins above replacement and gross domestic wins. Incorporating the WAR stat into the analysis of drafts and farm systems might be possible. Also, a deeper look into historical calculations might illuminate new trends. I set out to create a conceptual framework for which all baseball lovers can assess front offices and farm systems. I took a little different approach and had to make some adaptations to certain economic methods, but I feel it is a good start and hope others will find it handy.
Next post: 2015 Wild Four Tournament (Championship)Previous post: Analyzing Proposed Rule Changes, Part 2: The No-Pitch Intentional Walk

AD
More interesting analysis on this topic, especially as it pertains to Detroit, a team that has been criticized (Keith Law, others) for a bad farm/development system.